Getting Started
Data Studio Usage Guide
This guide is a basic guide to help you use Data Studio more effectively.
It's a space where you can easily check things that are difficult to understand with primary API data, and it's continuously being updated.
If you experience any inconvenience while using it, please provide feedback through the dev.ps Discord channel located at the bottom right of Data Studio.
- 1. Champion Analysis
- 2. Champion & Item Analysis
- 3. Champion & Rune Analysis
- 4. Item Value
- 5. Honey Build Lab
- 6. Duo Synergy
- 7. One-Trick List
- 8. Objective Analysis
1. Champion Analysis
- Basically, the champion analysis tab aims to help output the champion's power graph.
Here, a power graph shows how much power a champion has at different time periods. - While power can be defined differently by each person, lol.ps measures how directly it contributes to victory in terms of resource strength.
Therefore, from the mid to late game, we heavily weight the actual game win/loss coefficients, while for the laning phase, especially before 15 minutes when game outcomes cannot be determined, we use AI to measure power independently. - Generally, when the sample size is too small, the values may fluctuate significantly.
Points to Note When Sample Size is Small
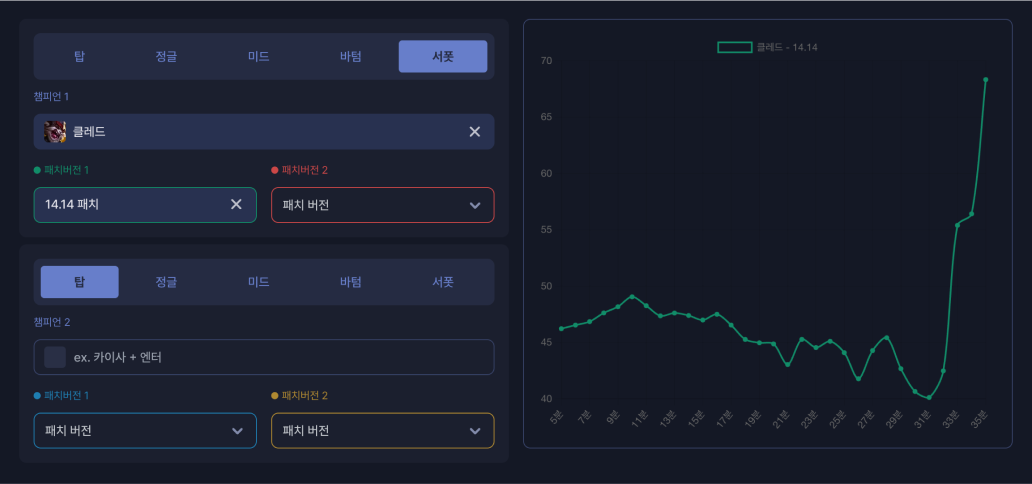
- For example, looking at Kled support with a small sample size, the number of games in the very late game is structurally bound to be small.
As a result, you can see the values fluctuating. - In reality, late game scenarios often have small sample sizes, and since they heavily reflect actual win/loss trends, values can spike as shown in the example above. You need to be aware of this when using the data.
How to Properly Examine Champion Analysis Power Graphs
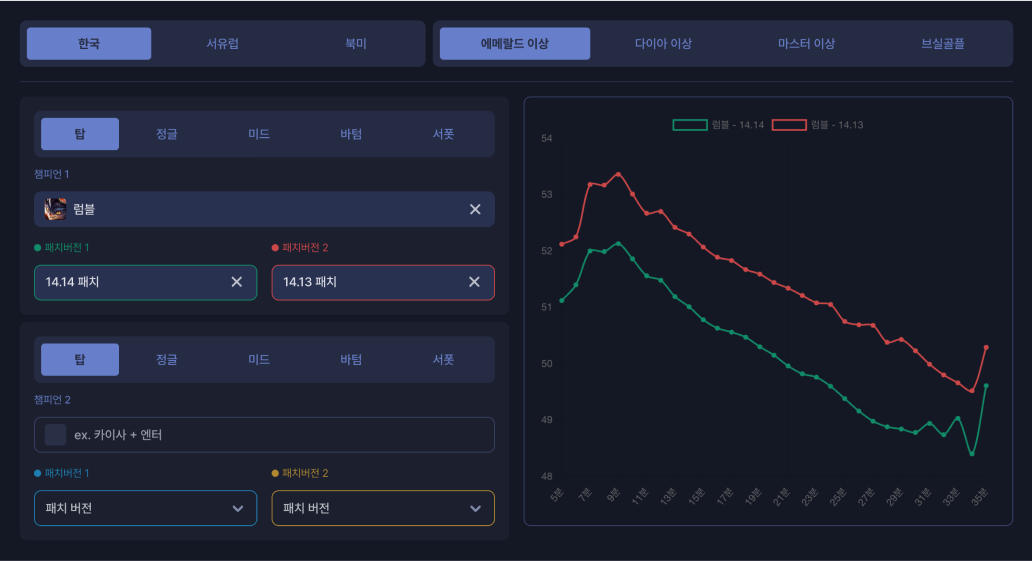
- The best way to utilize the champion analysis tab is to observe how a champion's power has changed after a patch version update.
This is because most variables remain constant except for the patch version change, allowing for the most accurate assessment of a champion's value. - However, samples may be limited at the beginning of a patch, and especially for Master+ tier, it takes about 4-5 days after the patch to secure enough samples, so it's reasonable to also consider Diamond+ tier indicators. Sometimes, you might need to review overseas indicators as well.
Comparing with a Baseline Champion
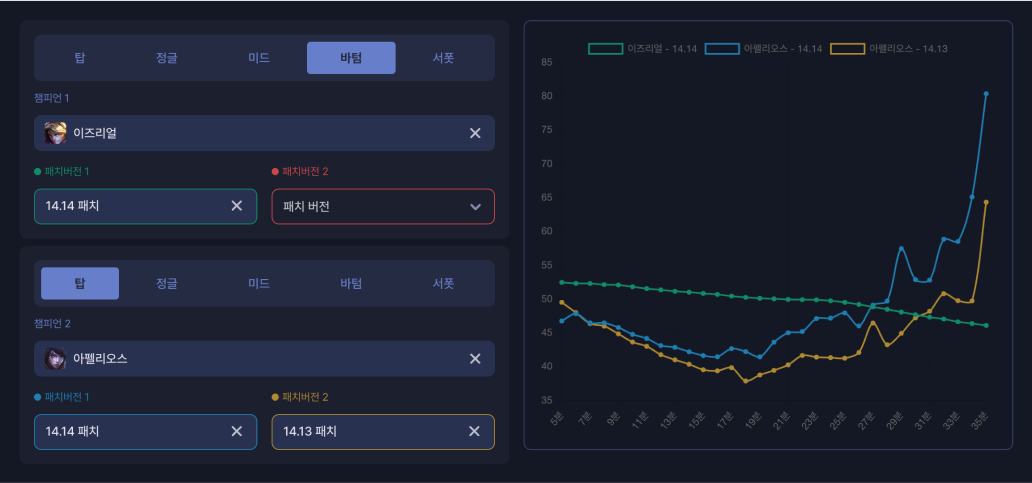
- Another approach is to use a reliable champion with consistently high sample sizes as a baseline. For example, using Ezreal as a baseline to compare Aphelios's power curves between the previous and current patches to see how much his performance has improved.
2. Champion & Item Analysis
- This is a method to check a champion's power graph when holding specific items. However, since this feature uses a smaller sample size and cannot perfectly control various variables, it's best to use it as a reference. Let's look at an example.
Example of Leona's Champion & Item Analysis Power Graph
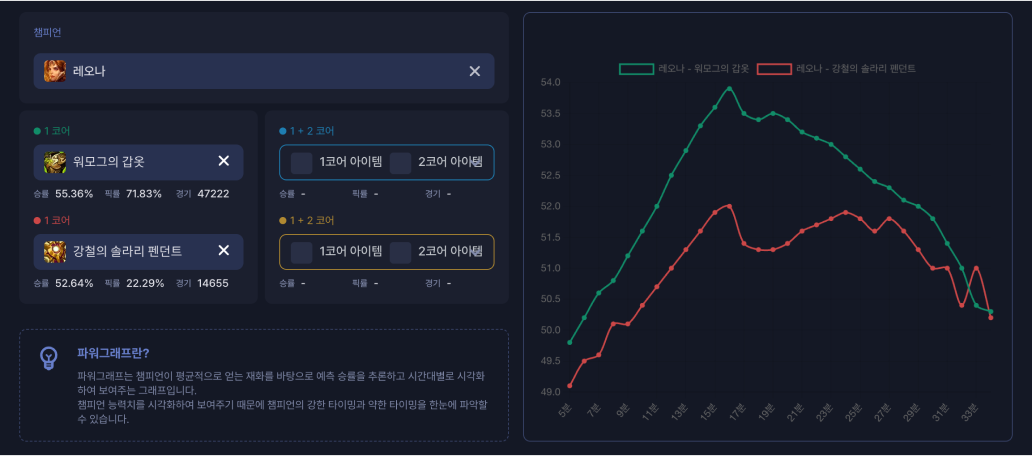
- The above graph shows Leona support's power curves when building Warmog's as first core item versus Solari.
- We need to keep in mind that Warmog's is typically completed around 17 minutes, while Solari is completed around 14 minutes. This means that before 17 minutes, the core item Warmog's cannot have any impact, only its components can affect the curve.
- Moreover, games where Warmog's wasn't completed before a loss aren't reflected in this graph. While typically first core items are completed between 11-13 minutes, or 14-15 minutes for supports, meaning most games should see a completed first core before the outcome is decided, making support Warmog's quite an unusual case, we still need to consider various factors rather than taking the graph at face value.
- For instance, looking at this graph, you might interpret the early game as Warmog's components are quite good, or alternatively, they went Warmog's because they were already ahead by this much. To distinguish between these interpretations, we'd need to break down the metrics more finely, but as we do so, we face sample size issues and need different approaches.
ex) Grouping tank supports together to secure larger sample sizes, then applying additional conditions per match to verify metrics
Since this requires significant resources, it's difficult to handle in regular services like Data Studio, and should be addressed through metric request services, PS GPT, or business inquiries.
Example of Aurora's Champion & Item Analysis Power Graph
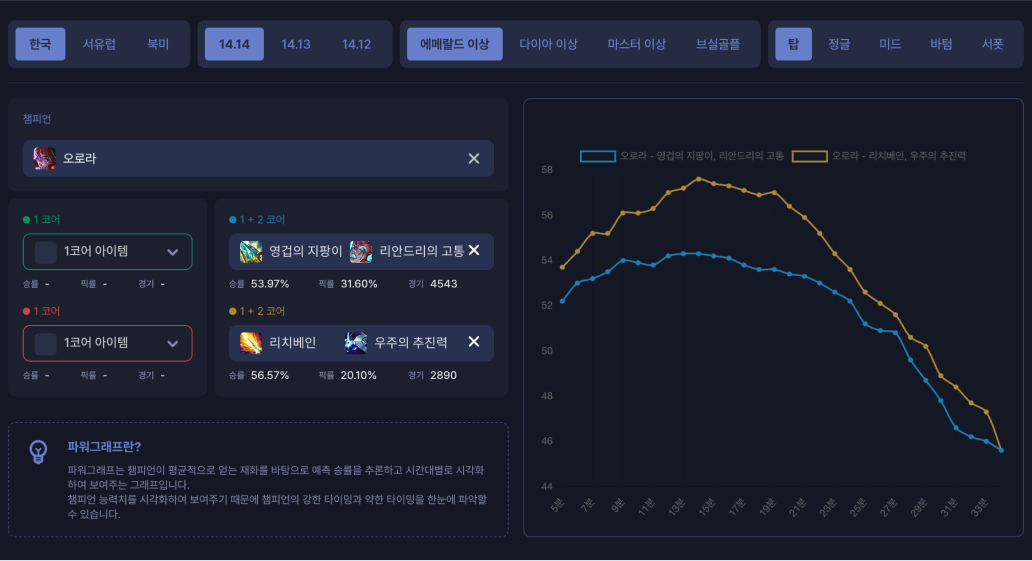
- The metrics up to two core items tend to be more stable to analyze. As long as the game progressed enough to build two core items, and if we consider early game metrics to be similar, it's quite useful for comparing mid-game power timing.
- However, for builds targeting specific matchups, the graph can't capture all that information, so it's important to understand in-game tendencies when looking at these metrics. For example, when top Aurora goes for a Lich Bane-based build, there might be a high proportion of cases where it's picked as a counter and gets extreme value from Lich Bane, or maybe the Lich Bane build path itself is just good for top Aurora. Therefore, we can't make detailed decisions based on metrics alone - it needs to be complemented by watching games or direct gameplay experience.
3. Champion & Rune Analysis
Validity Check Guide for Champion & Rune Analysis Graphs
- Rune analysis often uses smaller sample sizes than item analysis. Due to the wide variety of combinations, it's important to develop a habit of checking sample sizes.
- Other approaches are similar to the functionality explained earlier. However, in the rune analysis tab, comparison work requires using the screenshot feature.
How to Add Champion & Rune Analysis Graphs
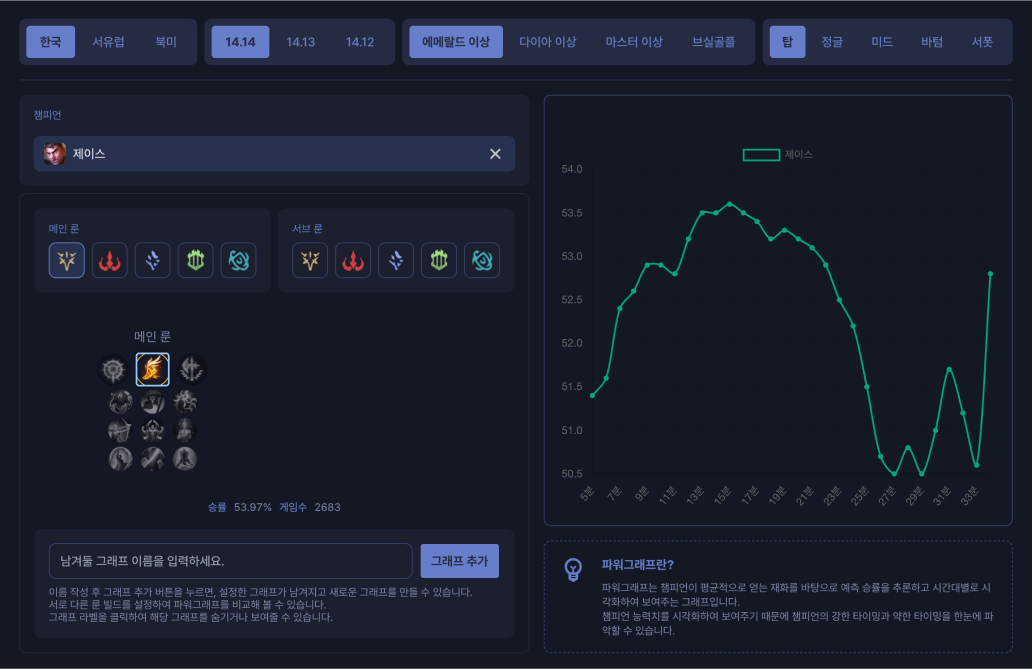
- For example, if you want to see how effective First Strike Jayce is recently, select only First Strike as shown in the image above, check the sample size of 2,638 games, then name it 'Top Jayce-First Strike' and click add graph to take a screenshot.
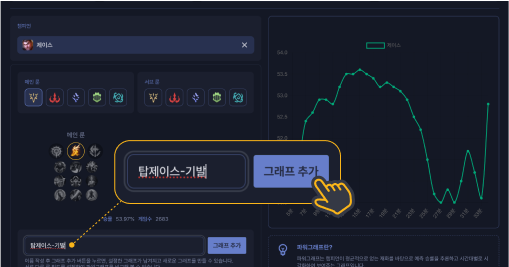 Enter 'Top Jayce-First Strike' as the graph name and click the [Add Graph] button.
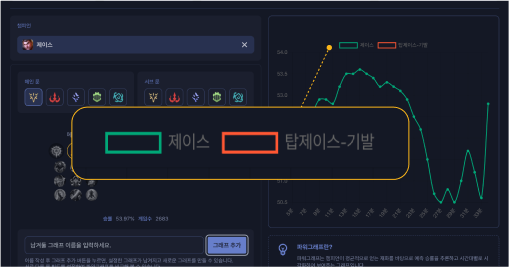 The saved graph appears at the top.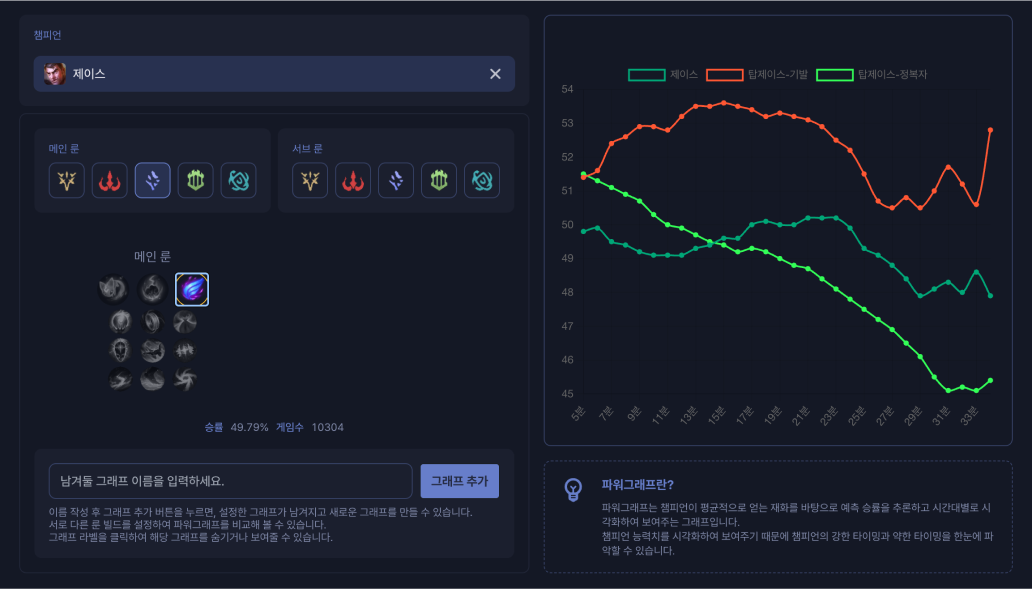
- Afterwards, you can compare power by adding graphs for Conqueror or Phase Rush, which Jayce traditionally uses. Unlike item analysis, runes affect the game from the start, so there aren't many other variables in the early game - just make sure to check the sample size thoroughly.
- Through this, we can see that when Jayce takes First Strike recently, it can potentially lead to a significant power increase.
How to Exclude Champion & Rune Analysis Graphs
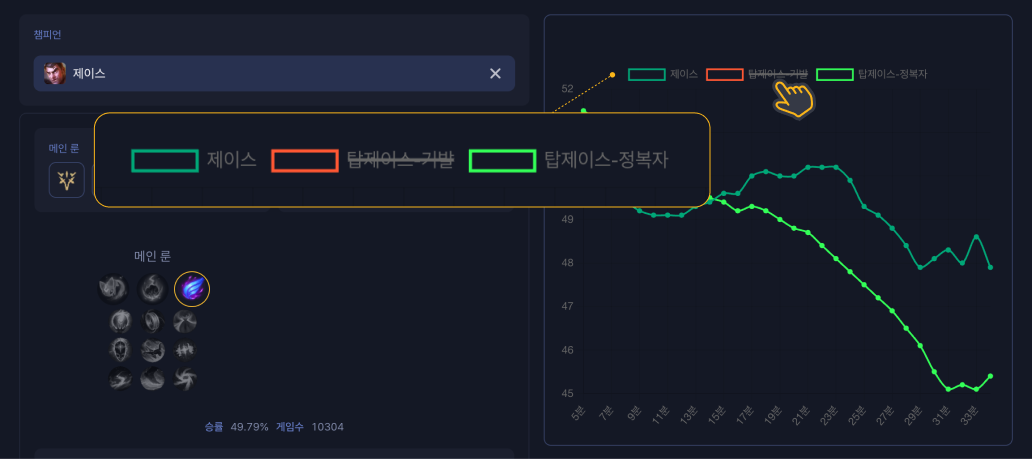
- If you want to exclude certain graphs, you can click on their boxes to remove them. Data temporarily hidden from the graph will be shown with a strikethrough.
4. Item Value
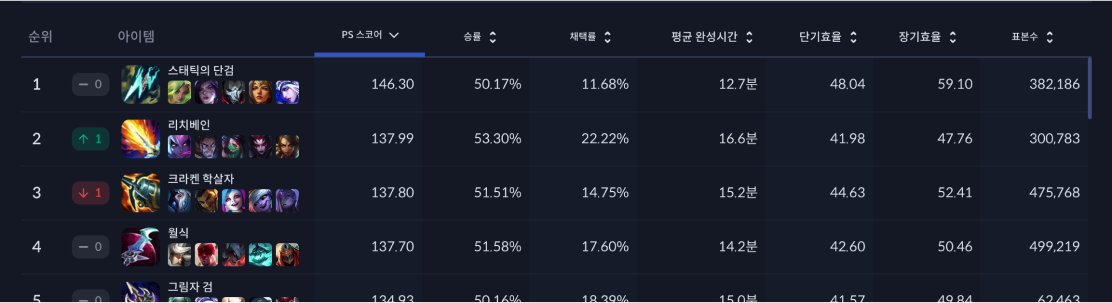
- The item value table shows rankings and scores based on a comprehensive consideration of win rate, adoption rate, average completion time, short-term efficiency, and long-term efficiency.
- Adoption rate is calculated based on how frequently a single champion builds the item. This means that high sample size alone doesn't lead to high adoption rate; rather, it shows how important the item is for certain champions.
- Short-term and long-term efficiency are metrics that measure how resource acquisition (gold, experience, etc.) changes from the point of item purchase.
- In other words, the PS score is influenced by meta champions in the current patch version and gives additional points for the item's resource generation and combat power. If you want to focus more on other metrics, you'll need to use the metric request feature or consult GPT separately.
5. Honey Build Lab
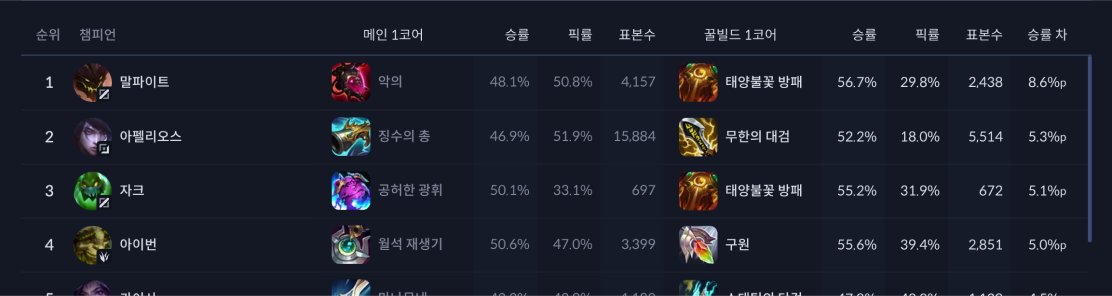
- The Honey Build Lab currently only provides 1-core builds and presents tables prioritizing win rate differences.
6. Duo Synergy
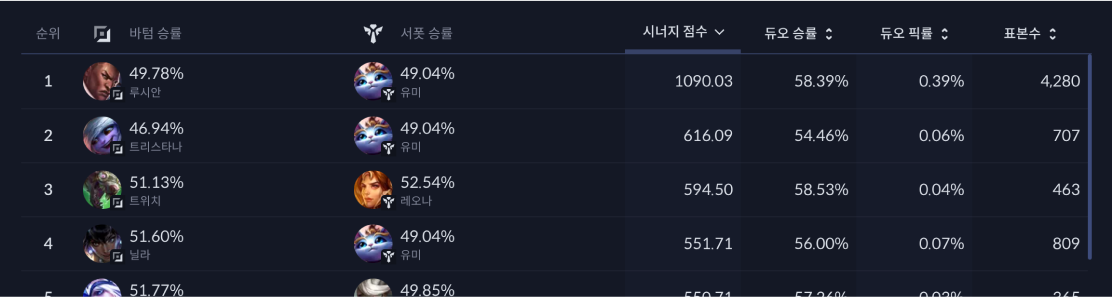
- Duo synergy is calculated based on how much the duo win rate improves individual win rates for each champion. As a result, combinations with small sample sizes may rank high; to avoid this, you can sort by duo pick rate.
- For more detailed duo performance statistics for individual champions, you can refer to the champion detail pages on lol.ps.
7. One-Trick List
- Another way to assess champion performance is by focusing on how one-trick players perform.
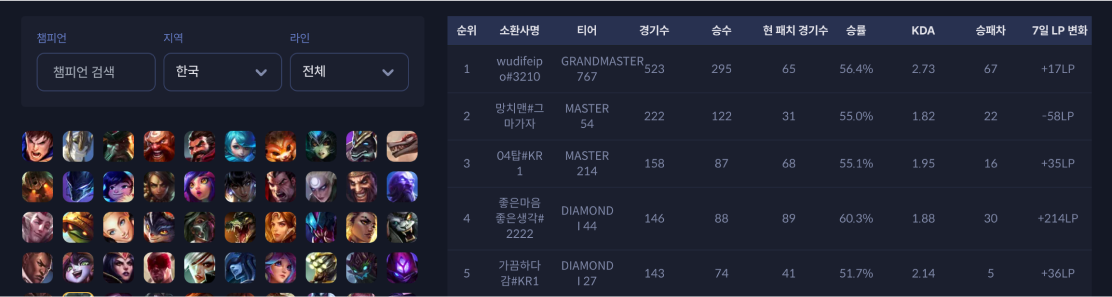
- For example, when examining Mordekaiser one-tricks, you can see how many games they've played in the current patch and how their LP has changed recently.
- This feature is particularly useful when you want to see how one-tricks are performing after a patch.
- Clicking on a summoner name will automatically take you to their match history page.
8. Objective Analysis
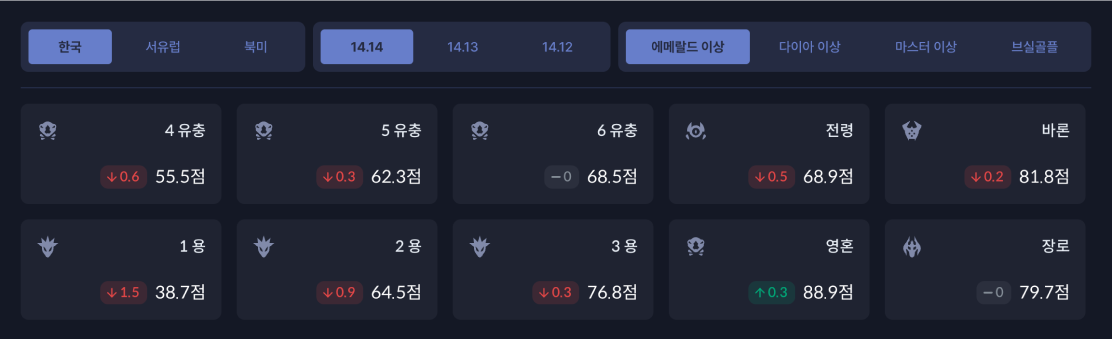
- Objective analysis shows calculated values of how strongly taking specific objectives correlates with victory.
- You can compare scores between patch versions and between different objectives, making it useful for assessing objective value.
Additionally, Data Studio is continuously being updated. Please refer to the 'Update History' section for new updates and changes as they will be regularly added there.